Summary Text
Projecting the Income Statement in an LBO Model: In this video series, we will review the process of projecting the three primary financial statements in an LBO model. To emulate the process that might take place on a live transaction, this is going to be a “quick build.” The objective is to develop a model that will help us (the investors) think through a transaction that should take place in the next 60 to 90 days.
To build something quickly, we are going to continue working with the workbook provided. The alternative would be to build a new template and then cut and paste the data into this new template, which can be time consuming and unnecessarily duplicative, particularly if you already have access to a template you know well. As a word of caution, though, in practice, this process should always be preceded by a thorough audit of the workbook or template, even if it’s one you’ve worked with in the past. While auditing may seem to be a waste of valuable time at first, building a model off of a workbook littered with errors or complex workarounds will be far more time-consuming, given all of the troubleshooting and rebuilding you will eventually have to do. Once you realize the foundation is faulty, you may have already spent too many hours on the model to start fresh and find yourself attempting to fix both the model and the template at the same time. So always check the workbook before you embark on your modeling.
Quick Recap
As a quick recap, the previous course was focused on recording the transaction. This was accomplished in three videos, which can be summarized as follows:
- Video 1: Framework for the Balance Sheet Adjustments
- Video 2: Sources and Uses Table
- Video 3: Linking the Sources and Uses Table to the Balance Sheet Adjustments
This means that the final balance sheet for the historical period now reflects the acquisition of BabyBurgers LLC. The next step is to project the financial statements, but before we move forward, it’s important to recognize that the swift process captured in the aforementioned three short videos belies what is actually a lot of human effort behind the scenes. “Recording a transaction” can sound abstract, so let’s provide some context.
Previously, the founder and CEO of the target company, BabyBurgers LLC, along with any other shareholders held 100% of the common stock of the target company. Interested in cashing out, the company hired an investment bank to sell the business, and you (playing the role of “private equity investor”) received some confidential information to review the opportunity. To demonstrate interest in the opportunity, you submitted an indication of interest, and in response you were invited to submit a letter of intent (LOI) summarizing the terms under which you would be interested in moving forward. It is at around the time of IOI submission or before LOI submission that you will start building the LBO model to better evaluate the transaction.
Note: We moved through that quickly because this process is described in fantastic detail in the lesson titled “Securing Exclusivity,” which is part of the Private Equity Training curriculum.
The purpose of building the model is to assist in beginning to think through valuation, risk and capital structure. At this stage, your firm is already conducting due diligence, and once the LOI is executed, you will begin to negotiate the Stock Purchase Agreement , which as an aside is the single most important document in a stock acquisition (for more information on the stock purchase agreement and many other related topics, please see the Private Equity Training curriculum).
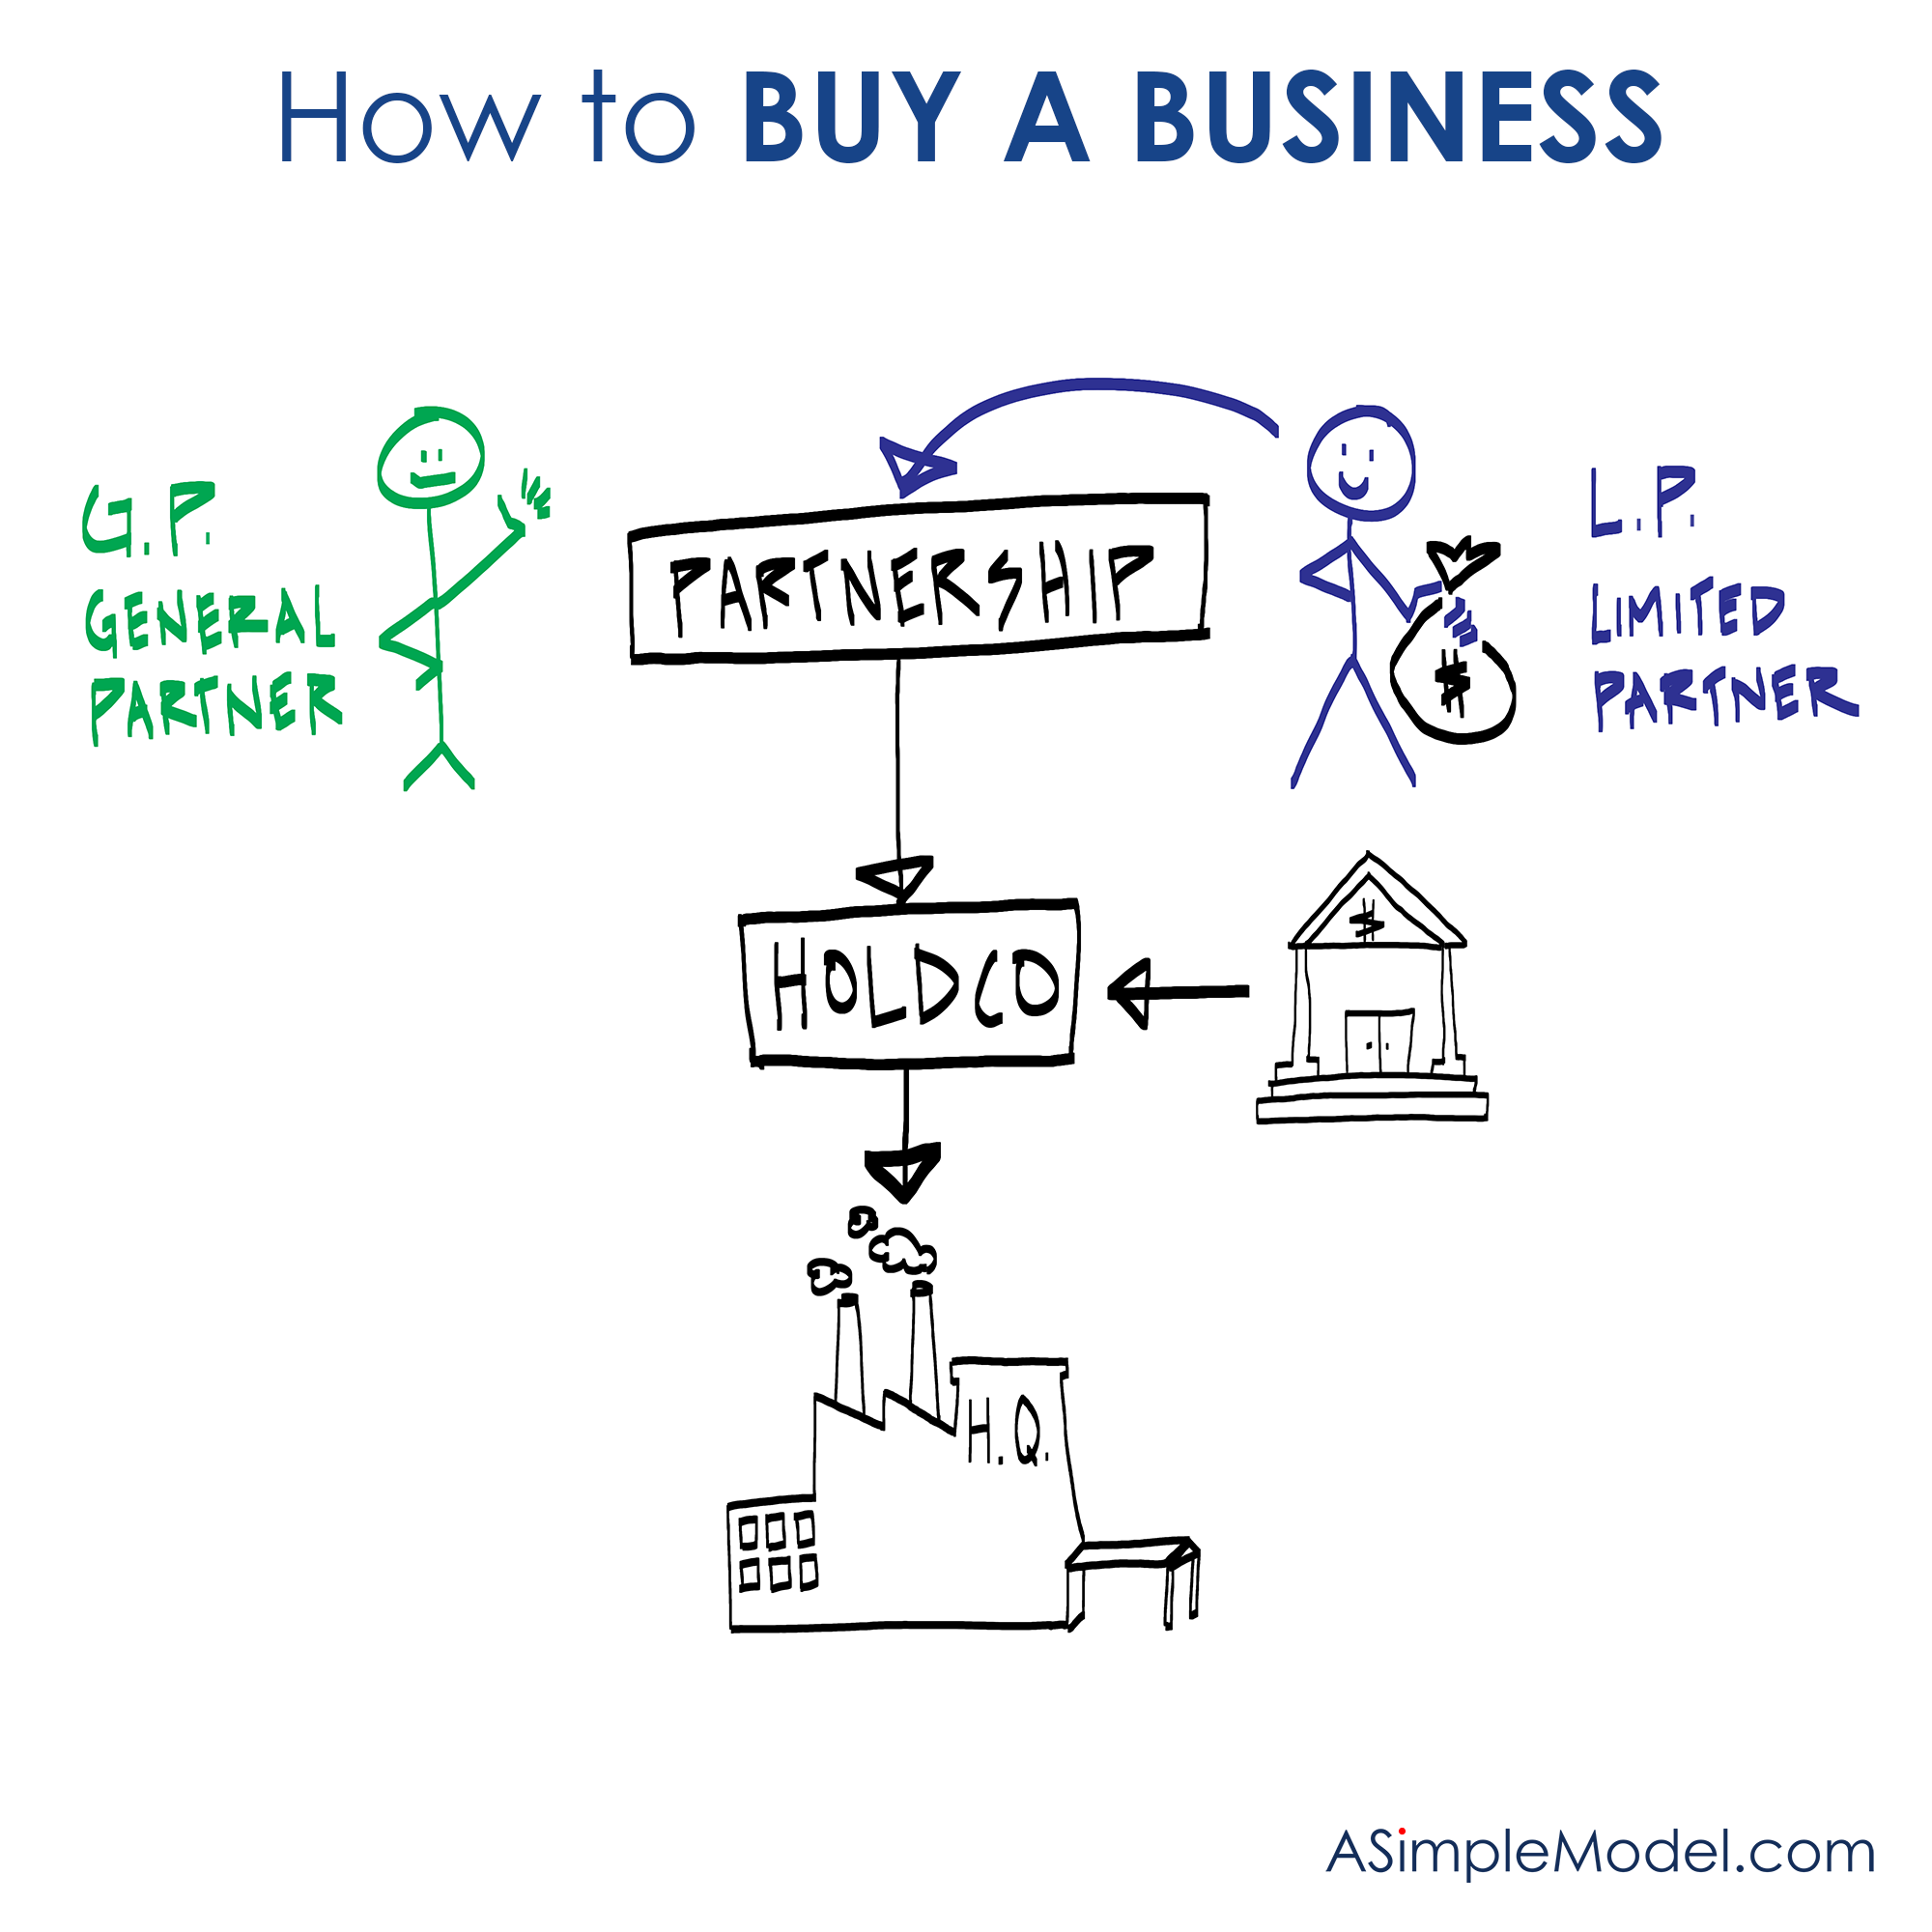
As the transaction moves towards a close, the Buyer will most likely create a new entity, which we will call HoldCo (please see image / incredible artwork below) , and this entity, post-transaction, will “hold” (meaning own) the business being acquired. It is important to recognize that outside of the new ownership structure, nothing about the business has changed. Until the new control investor (you, in this scenario) decides to make changes to how the company is operated, the only difference pre- and post-transaction is the company’s capital structure.

This is especially important to keep in mind as we work through this exercise, because aside from this one change, the process of projecting the financial statements is nearly identical to the process of building a three-statement model. In this lesson, we will discuss more theory than mechanics, so if you have not watched the Integrating Financial Statements video series, I would recommend it as a prerequisite.
Adjustments to the Workbook
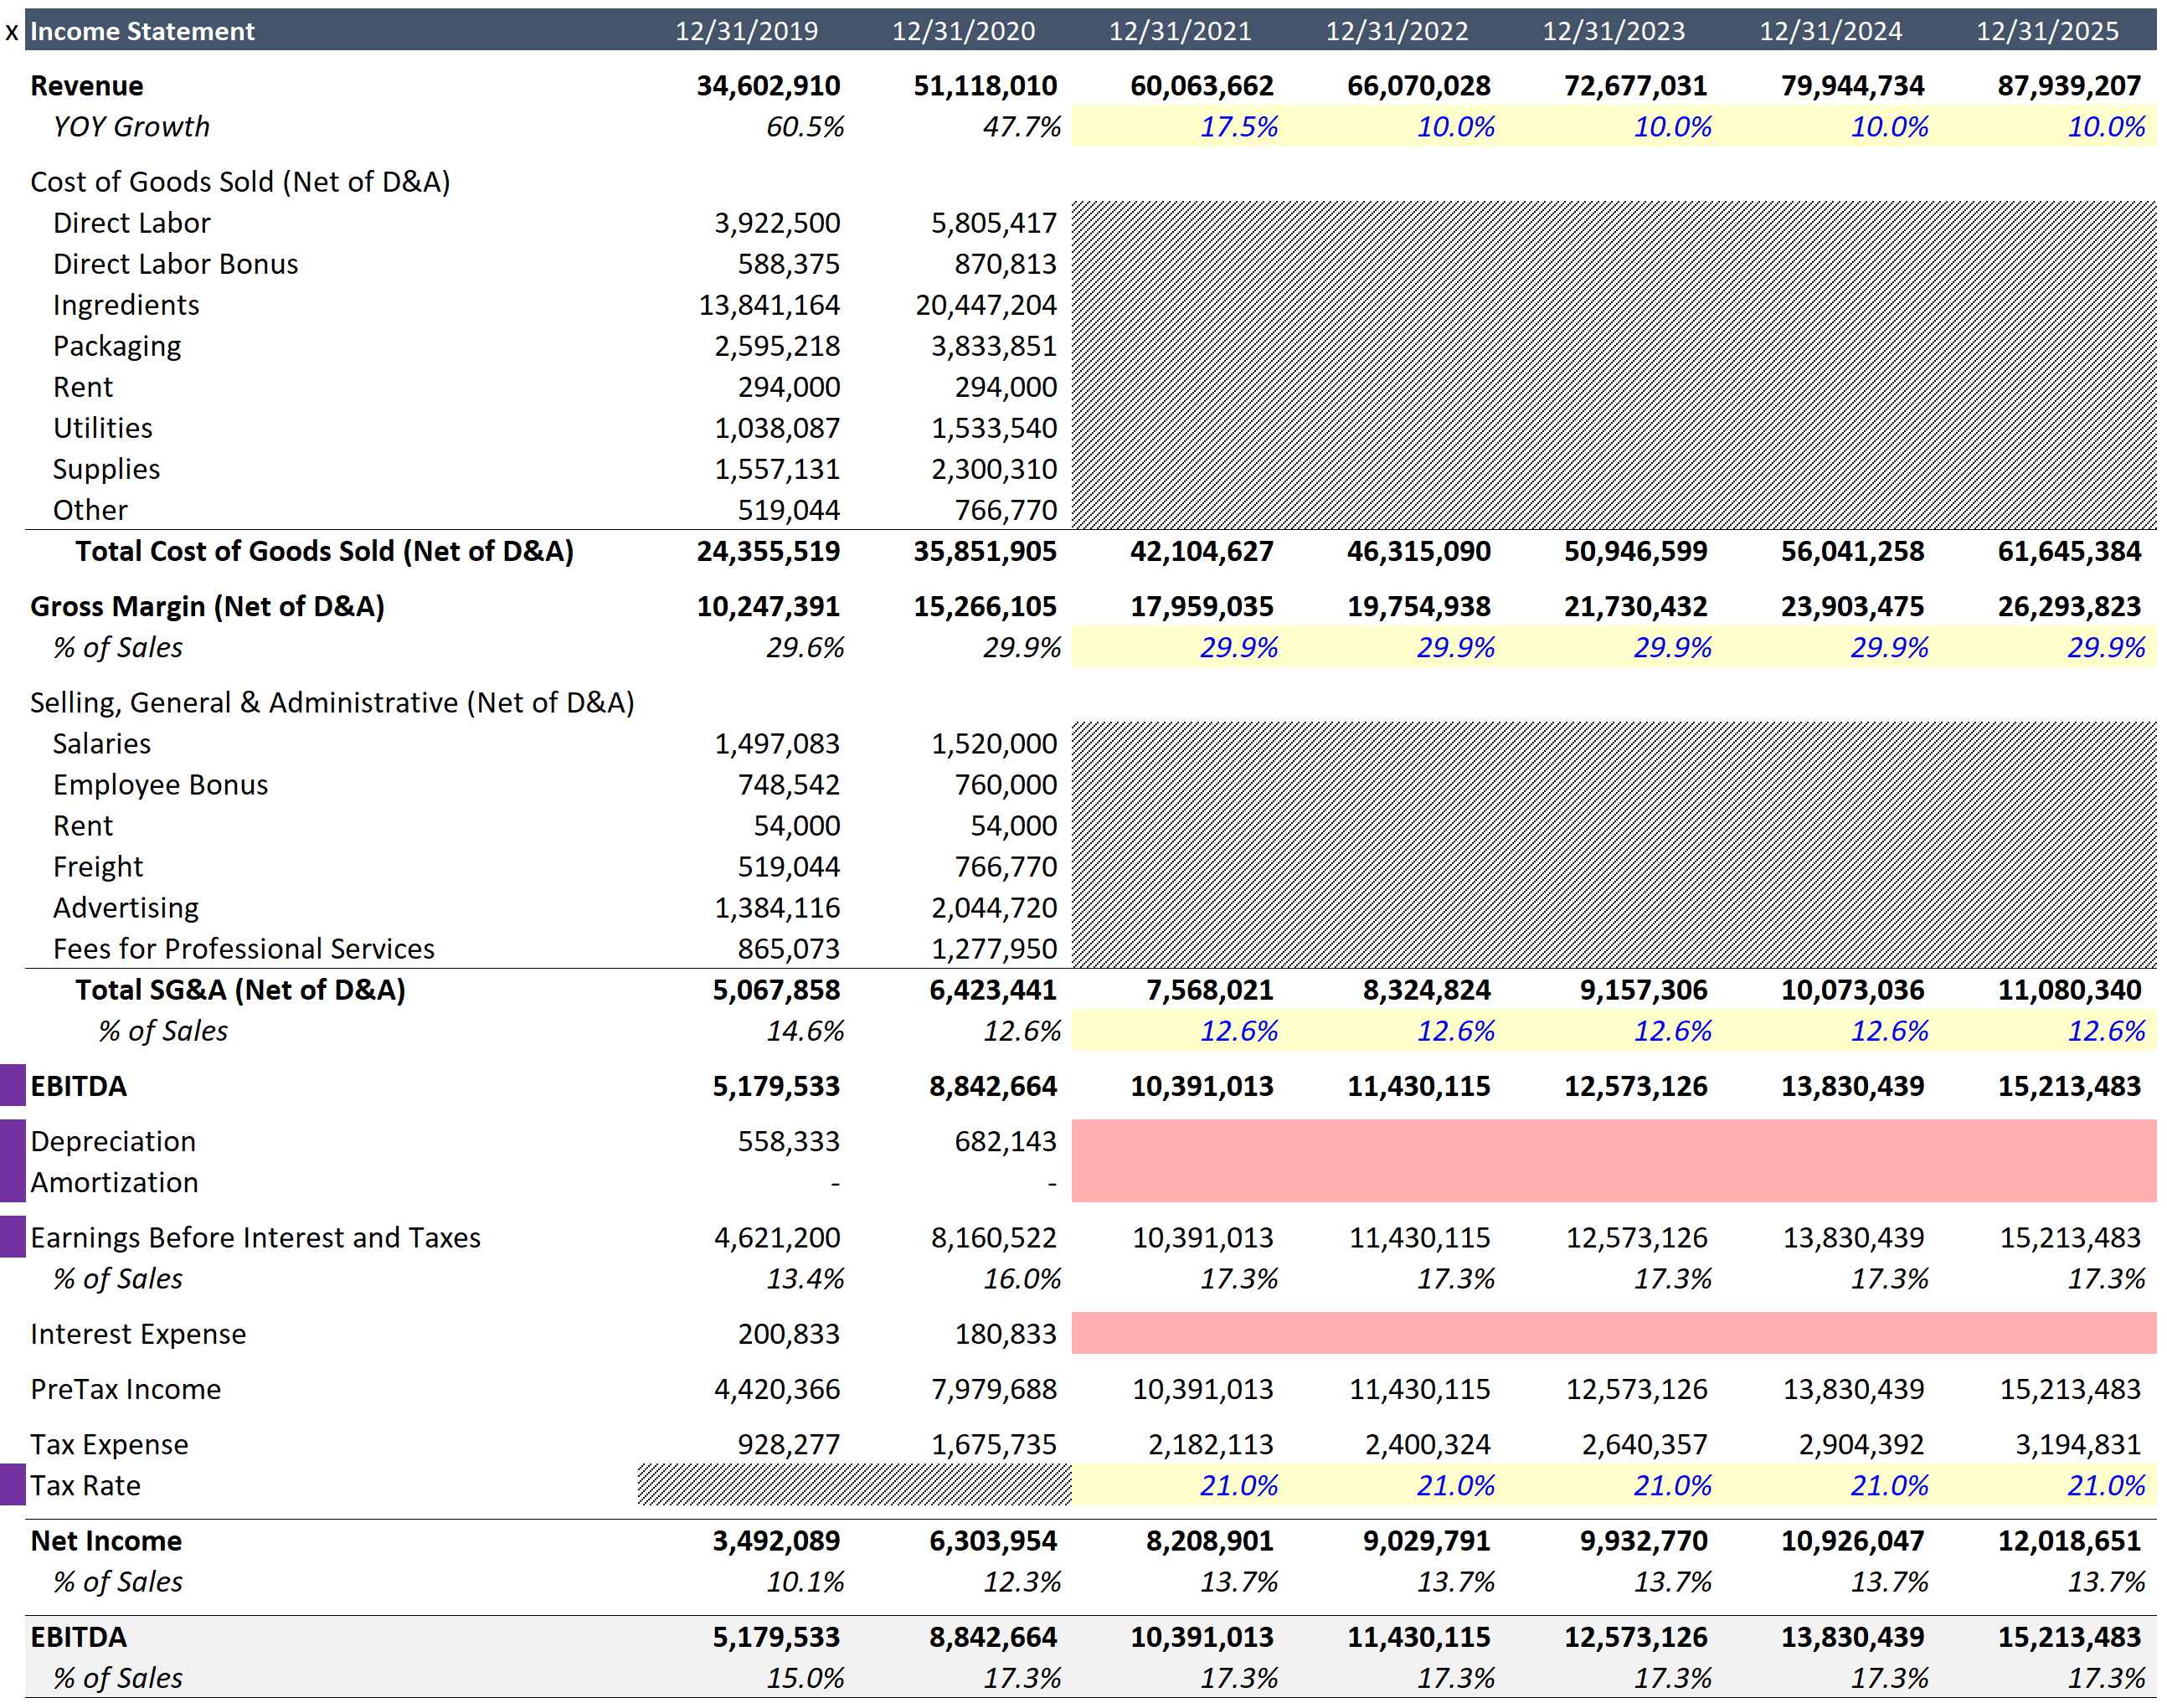
Before we get started with the projection, we need to make some adjustments to the income statement that are non-GAAP. More precisely, we are going to remove depreciation from COGS and SG&A, and then we will provide separate line items further down for depreciation and amortization (changes indicated by purple-shaded cells in the image below).
Per GAAP and IFRS, depreciation is, of course, included in COGS. You will also find that the three-statement model taught as part of the Integrating Financial Statements video series is projected as though depreciation is included in COGS, but the logic for excluding it is as follows:
- If you are forecasting historical information without contemplating a change to operations, where the intention is to continue along the same growth trajectory, then projecting depreciation as part of COGS generally works. But since private equity strategy frequently contemplates a change in capital structure and investment, it is likely that capital expenditures will look different post-transaction.
- This approach also neutralizes any impact that depreciation might have on gross margin, which is one of the most important metrics contemplated in the forward period. A change that accelerates the way depreciation is accounted for might reduce gross margin, for example, even though nothing else about the business has changed.
Per the video, this change is made in four steps (please refer to the video and Excel workbook for a more thorough explanation):
- First, add rows for EBITDA, Depreciation and Amortization.
- Second, since this income statement pulls from the operating model, input your totals as formulas for the income statement.
- Third, highlight the contents of the cell for depreciation and copy the contents with Ctrl + C. Next, paste the cell reference in the line item for depreciation, added in the first step. Finally, delete depreciation from its original location to avoid double counting.
- Finally, LABELS! Accurate labels are incredibly important. If you make this change without including “Net of D&A” in all the appropriate places, someone reviewing your work might believe it to be an error or oversight.

These are the only adjustments made to the income statement before moving on to the projected period. As you will note, this is largely about presentation. In other words, the change does not impact the profitability of the business. So why is it important?
- This presentation allows you to evaluate COGS in the projected period net of depreciation and amortization. Depreciation is a non-cash expense largely dictated by tax law and accounting standards, which makes it less relevant to profitability.
- This presentation includes EBITDA on the income statement, which is a frequently cited measure of profitability in most LBO transactions.
When structural changes are made that are not intended to affect outcomes, I find it can be helpful to use the Snipping Tool to quickly identify any unintentional errors. Please see the video to see how this can be accomplished.
Conservative Bias
The notes will not walk through the formulas used to project the income statement, because I believe this can be done far more effectively with video. That said, I do want to emphasize that on the first iteration of a model, I like to project with a highly conservative bias. In the video commentary, you will hear me state that I am intentionally sandbagging the projected period. Early on in building any model, my objective is to make sure that it is mechanically sound, and while I always intend to revisit all of the inputs driving the model in great detail later on, it is my preference not to have anything overly optimistic included without strong supporting detail. Preparing a bid supported by an overly optimistic driver that was somehow overlooked after being thrown in early on is a nightmarish scenario. For that reason, when I am working under time constraints, I take an overly conservative approach to the inputs driving the model. Once it is all built, I will come back and fine tune the inputs once I have more time and information to consider them with.
Final Comments on Earnings
There will always be much discussion surrounding whether or not a company missed or beat earnings. This applies as much to publicly traded entities as it does to private companies. As the date of the transaction approaches, EBITDA, which is generally the measure of earnings supporting enterprise value, will be closely scrutinized. Transactions can fall apart if the EBITDA fluctuates in advance of the close and the parties fail to take the time to explore the cause.
As an investor, it’s important to understand if the deviation is due to business fundamentals or simply to timing. Examples of business fundamentals-related drivers would include the following:
- Loss of Customers
- Same-Store-Sales Changes
- A Percentage Change in the Number of Nonperforming Loans
In contrast, a large customer delaying an order might be more accurately assessed as a timing discrepancy (investors should confirm this in due diligence). If there is otherwise no indication that the related revenue is at risk, it might be a timing change worth tolerating to secure the transaction. Regardless, the ability to evaluate the severity of the miss is of critical importance because changes in enterprise value leading up to a close are extremely sensitive. If the deal is important to you, be certain you thoroughly understand why earnings missed before suggesting that valuation be revisited.

